Reporting

Reporting
Make data-driven decisions to improve your team’s performance
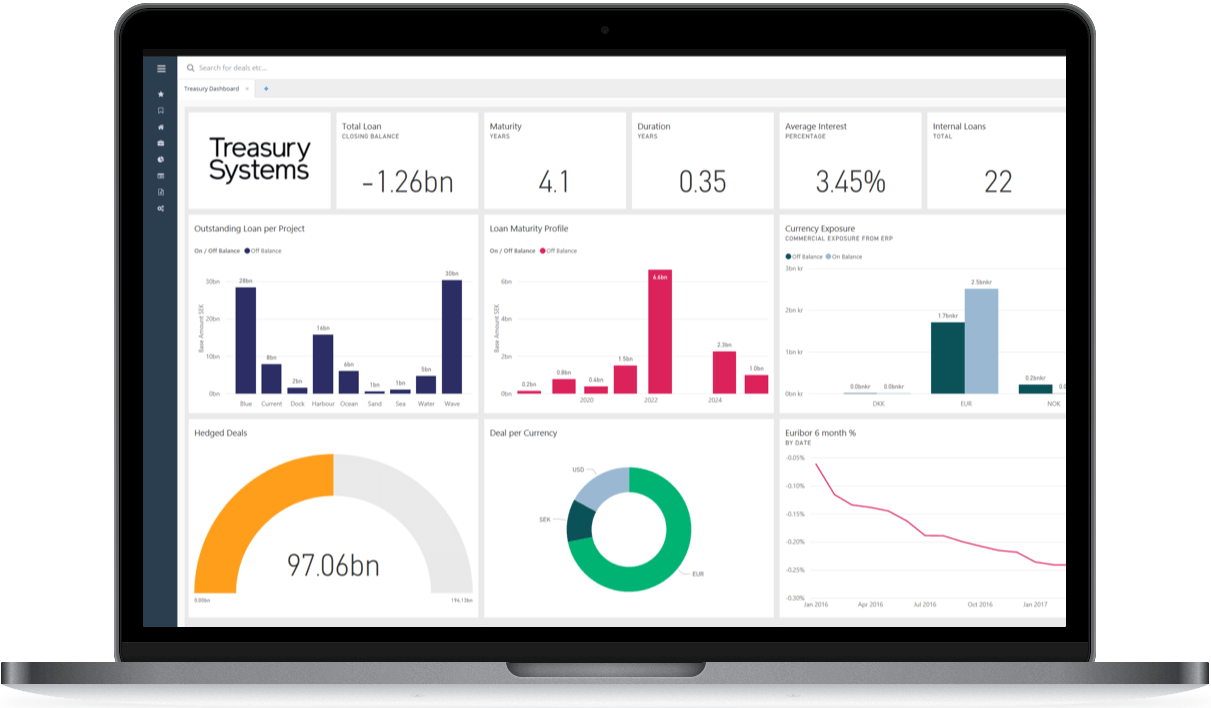
With Treasury Systems we have built upon our philosophy that report management belongs to the user. With our easy-to-use and most comprehensive reporting tool you get complete control over your reporting process. Reports can easily be edited, updated and adapted to the users liking. All common treasury KPIs and risk measures are available and searchable for the user to get exactly the data you want.
Get started fast with report templates
Instead of boxy standard reports that do not fit your needs we give you templates. With our best practice templates you quickly get off the ground with a new report based on different reporting areas such as balance sheet, profit / loss, cash flow, market valuation, interest expense. Rearrange content, add and subtract columns and KPIs to your liking and save your report. You can even create your own templates for your organisation.

Slice and dice with
grid mode
Quickly sort, filter and aggregate your data the way you want. Create drill-down with summation on up to five levels and enjoy jump-to-deal links to quickly jump from a report to deal views.

Put some paint on it with Power BI
Our best-of-breed philosophy extends and enhances treasury reporting even more. By leveraging and integrating Microsoft Power BI into Treasury Systems we can support even the most demanding reporting requirements and deliver more value and insights to your reports and dashboards.

NEW
Distribution Reports
Send confirmation letters, internal bank statements, management reports and more to your internal stakeholders for better documentation and follow-up. You get complete control over design and content as well as distribution rules and criteria.
Can be distributed to each subsidiary or a selected group of email addresses with complete control over email subject, body text and output format. The receiver of the reports does not need to have access to Treasury Systems.
Large datasets with pivot mode
With Pivot Mode you can fit even more data into a single report by taking control over both the X and Y axis. You can set both columns and rows as you please to get better insights on your data as well as filters and sorting orders. Perfect for large data sets.

NEW
Market valuation of CCIRS
Treasury Systems now supports importing and automatically creating highly sophisticated market valuation curves including tenor and currency spread for a more accurate valuation of cross currency interest rate swaps (basis swaps). The valuation can be shown in reports as well as exported via the accounting view.
Geek out with custom measures
In addition to hundreds of ready made KPIs and measures you can create your own measures and scenario calculations and use them in multiple reports. Custom measures can also be used for other purposes such as accounting and risk management. Excel really is a thing of the past.

Other popular reporting features
Simulation
Simulate scenarios for forecast and budget purposes.
Automation and scheduling
Get specific reports regularly in your inbox.
Real-time reports
Real-time market valuation and refresh of deals.
Schedule a demo today
Let us show you how you can spend less time managing more operations.
CONTACT US
Want to know more?
Feel free to request a demo.
Or give us a call at +46 (8) 660 88 30
Treasury since 1984
Treasury Systems was founded in 1984 under the name of Currency Risk Management. Our latest system has been innovated through experience and is the result of a close relationship with our partners.

Valhallavägen 117F, S-115 31 Stockholm, Sweden
Phone: +46 (8) 660 88 30
info@treasurysystems.com
www.treasurysystems.com
Want to know more?
Feel free to request a demo.
Or give us a call at +46 (8) 660 88 30
Treasury since 1984
Treasury Systems was founded in 1984 under the name of Currency Risk Management. Our latest system has been innovated through experience and is the result of a close relationship with our partners.


